60 Latest Design Statistics for 2023
arrow_back Marketing Statistics

60 Latest Design Statistics for 2023


In this Marketing Report:

Most people say that content is king. But when it comes to websites, design is queen. These 60 design statistics will prove us right. But we’re not stopping there. We’ve analyzed how the industry is built and how it leads the way companies communicate with their potential customers.

With over half a million employees (graphic designers, web designers, etc.) and a global market size of $43.4 billion, the design industry is more than just a creative concept. It’s a way to innovate, inspire trust, and build your brand’s image.

General Design Statistics

92.6%

of people say that the visual dimension influences purchase decisions

Nike

A graphic designer student created the Nike logo for $35

Branding

Logo and branding design accounts for $3 billion of the total graphic design market

Cost of famous brand logos in US dollars.

  • The global graphic design industry ranks 9th among all business activities. (IBISWorld)
  • By 2020, there will be more than 400,258 graphic design firms worldwide. (FindStack)
  • After seeing something, people can remember 65% of visual assets 3 days later and only 10% of written content. (FindStack)
  • 92.6% of people say that the visual dimension is the number one factor influencing purchase decisions. (Neil Patel)
  • The cost of graphic design is a major concern for small businesses. (99 Designs)
  • The vast majority of companies (73%) invest in design to differentiate their brand. (Adobe Digital Intelligence)
  • Organizations admit that producing graphic design assets consistently is one of their biggest challenges. (Venngage)
  • WordPress is the most popular content management system with a 63.3% market share. Followed by:
    • Shopify: 5.5%
    • Wix: 3.7%
    • Squarespace: 3.1%. (W3Techs)
  • Carolyn Davidson, a graphic designer at Portland State University, created the Nike logo for $35. The Coca-Cola and Google logos cost $0. (IllustratorHow)
  • Logo and branding design accounts for $3 billion of the total graphic design market. (IBISWorld)

Website Design Statistics

94%

of first impressions are based on website design

1.65 sec

is the average page speed of the top 10 Google results on SERPs

$3,200

Is the average cost to design a basic website

Most common web design mistakes

  • Catch your audience’s eye! 94% of first impressions are based on website design. (Web FX)
  • Design has a 75% impact on a website’s credibility. (Web FX)
  • 84.6% of people prefer a clean look to a cluttered site design. (Saga Pixel)
  • A slow website can result in the loss of potential customers. 47% of website visitors expect a website to load in 2 seconds or less. (Web FX)
  • Slow-loading websites cost $2.6 billion a year in lost revenue. (AndyHooke)
  • The average page speed of the top 10 Google results on SERP is 1.65 seconds. (Blogging Wizard)
  • 34% of consumers are more likely to make an unplanned purchase after receiving personalized content. (Web FX)
  • The elements consumers value most in website design are:
    • Photos and images: 40%
    • Color: 39%
    • Video: 21%. (Top Design Firms)
  • The most common web design mistakes made by small businesses include:
    • Overcrowded web design: 84.6%
    • No CTA: 38.5%:
    • Hidden navigation: 30.8%
    • Poor web typography: 26.9%
    • Poor use of white space: 19.2%. (DDIY)
  • The average cost to design a basic website is $3,200. And it can take up to 2 months to create a site with basic functionality. (GoodFirms)

Responsive Design Statistics

90%

of all websites are mobile-friendly

73.1%

of the times people leave a website because it’s not mobile-friendly

1.71 billion

websites are responsive, or 90% of all websites

Global mobile phone website traffic share

  • Smartphones account for 57% of global website traffic. There are approximately 4.32 billion active mobile Internet users. (Exploding Topics)
  • Non-responsive design is the reason website visitors leave 73.1% of the time. (Innoraft)
  • It is estimated that 1.71 billion websites are responsive. This means that 90% of all websites are mobile-friendly, a number that is expected to continue to grow. (InternetLiveStats)
  • Mobile sites that load in 2 seconds or less have a 15% higher conversion rate. (Think With Google)
  • 48% of users are annoyed or frustrated by a website that isn’t mobile-friendly. (Google)
  • Frustration can only hurt your business. More than 60% of mobile users will go elsewhere if they cannot get what they are looking for quickly. (Google)
  • 74% of users are more likely to return to mobile-friendly sites. (Web FX)
  • 57% of Internet users admit that they wouldn’t recommend a company that has a poorly designed mobile site. (socPub)
  • 50% of smartphone users are more likely to use a company’s mobile website because they don’t want to download an app. (Think With Google)
  • 68% of companies that have developed a mobile-first website have seen an increase in sales. (SAG ipl)

Graphic Design Statistics

$53,830

is the U.S. average salary for a graphic designer

Freelance

graphic designers make up about 90% of the industry

5 – 10 K

32% of companies spend between $5,000 and $10,000 per year on graphic design

User's Visual Content Preferences

Graphic Design Industry Statistics

  • The global graphic design market size is $43.4 billion. (Colorlib)
  • The global graphic design industry employs over half a million people (507,690 jobs) (Colorlib). And in the U.S., the average graphic designer earns about $53,380 per year. (Bureau of Labor Statistics)
  • The industries that employ the most graphic designers are:
    • Fortune 500 companies: 17%
    • Media: 14%
    • Retail: 11%
    • Professional: 10%
    • Technology: 10%
    • Education: 8%
    • Manufacturing: 5% (Colorlib)
  • Demand for graphic designers is projected to grow by 3% by 2031. (Colorlib)
  • Freelance graphic designers make up about 90% of the industry. (IBISWorld)

Graphic Design Statistics

  • Using a signature color can increase brand recognition by up to 80%. (Colorlib)
  • 32% of companies spend between $5,000 and $10,000 per year on graphic design. Only 17% spend less than $1,000. (Piktochart)
  • 4 out of 5 small business and startup founders believe design is important to success. (99designs)
  • Communication is the #1 reason businesses use graphic design. They use it either to communicate with customers (55%), to post on social media (24%), or to communicate with their employees (19%). (Piktochart)
  • Visual content comes in a variety of forms. People prefer:
    • 32.5% original graphics
    • 29.5% stock photos
    • 15.1% charts and data visualizations
    • 12.7% videos
    • 5.4% multi-page documents. (Venngage)

UX Design Statistics

ROI

for investing in good UX design can be 100%

90%

of shoppers switch to a competitor after a poor user experience

Video

Users spend 88% more time on pages with video

Factor Influencing Cost of Web Design

  • 60% of shoppers consider usability to be a critical design feature for online stores. (Statista)
  • Better mobile UX design is a game changer as it affects the return of more than 70% of users. (Web FX)
  • The ROI for investing in good UX design can be 100%. For every $1 you spend, you make $100. (DiviFlash)
  • 90% of shoppers switch to a competitor after a poor user experience. (Web FX)
  • 88% of online shoppers may not return to a site after a bad experience. (BusinessDIT)
  • Sites with a superior user experience can have 400% higher conversion rates. (Forrester)
  • Users spend 88% more time on pages with video. It helps with engagement numbers and user experience. (Web FX)
  • 76% of users say “ease of use” is an essential element of website design. (HubSpot)
  • 54% of users believe that having too many ads on a website is the biggest obstacle to a good user experience. (IAB)
  • 59% of people prefer to browse “beautiful and well-designed” sites over basic ones. (Adobe)

Flat Design Statistics

88.5%

of web designers say flat design is the most popular design trend

21%

will leave a site because of flashy colors

6 sec.

People spend about 6 seconds looking at the navigation bar


  • 88.5% of website designers say flat design is the most popular design trend today. (GoodFirms)
  • When first visiting a website, 22% of visitors look for eye-catching colors. However, 21% will leave a site because of flashy colors. (WPbeginner)
  • Although it’s an important part of web design, only 8% of people notice white space when they first visit a website. (WPbeginner)
  • Despite the importance of typography, only 18% of consumers look at a website’s typeface when they first visit the site. (WPbeginner)
  • 61.5% of website designers say they currently use expressive typography in their designs. (GoodFirms)
  • People spend about 6 seconds looking at the navigation bar (Missouri University of Science and Technology), and 80% of their time looking at information on the left side of the page (NNGroup).
  • Users spend approximately 57% of their time viewing pages above the fold and 74% on the first two screens. (NNGroup)
  • Red buy buttons can increase sales and increase conversions on e-commerce sites by 34%. (CXL)
  • A color theme improves website recognition by 80% (Forbes)
  • 26% of consumers prefer primary color schemes, 21% prefer complementary color schemes, and 20% prefer analogous color schemes. (Top Design Firms)

Conclusion

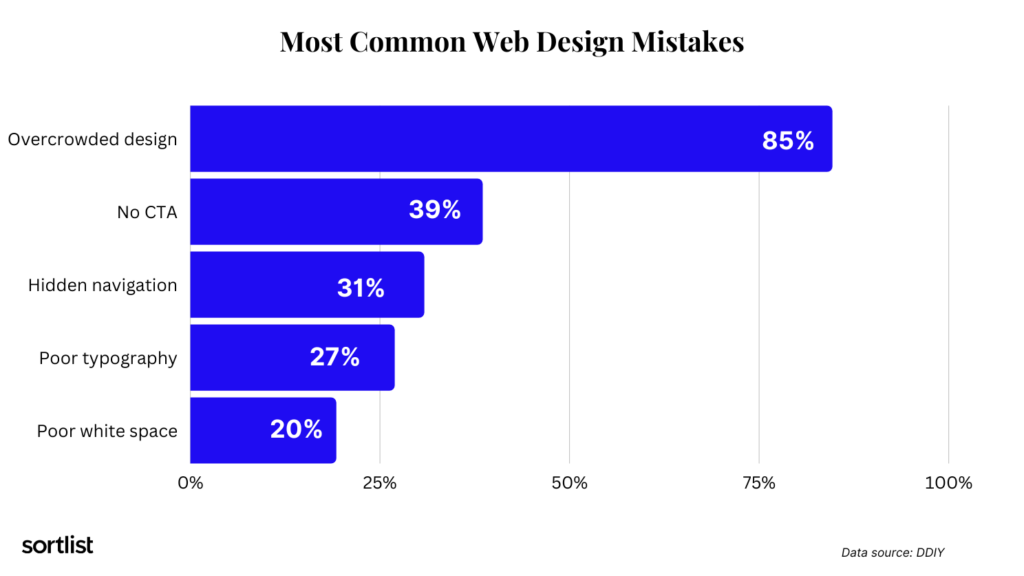
From colors to white space, to navigation bars, to load times. These 60 design stats will give you enough information to optimize your website and creative designs to create the best experience for your audience.

We live in an increasingly visual world. So you need to act on it and stand out from the crowd. Be different and give your audience the tools and information they need to become customers.

Featured in

About the Sortlist Data Hub

The Sortlist Data Hub is the place to be for journalists and industry leaders who seek data-driven reports from the marketing world, gathered from our surveys, partner collaborations, and internal data of more than 50,000 industries.

It is designed to be a space where the numbers on marketing are turned into easy-to-read reports and studies.

close

Access our exclusive content!

email