ecommerce statistics wordpress featured image
arrow_back Marketing Statistics

Here’s a List of +70 E-commerce Statistics Per Country (2023)


The rise of e-commerce has transformed the way we shop, with online shopping becoming increasingly popular across the globe. With the global pandemic accelerating the shift towards online shopping, more and more people are turning to e-commerce platforms for their shopping needs. As a result, e-commerce has become an integral part of the global economy, with businesses of all sizes increasingly turning to online marketplaces to reach new customers and grow their sales.

In this E-commerce Statistics page, take a closer look at the e-commerce landscape around the world and explore the latest e-commerce statistics by country, highlighting the key trends and developments shaping the industry today. From the rise of mobile commerce to the impact of social media on online shopping behaviour, this page will provide a comprehensive overview of the state of e-commerce in different parts of the world.

Global E-commerce Statistics

$4.9 trillion

Retail e-commerce sales worldwide

19

Online transactions per consumer per year

Argentina

Country with the fastest e-commerce growth

statistics for global retail sales in ecommerce

  • In 2021, retail e-commerce sales were an estimated $4.9 trillion U.S. dollars worldwide. (The Social Shepherd)
  • Over the next four years, it’s predicted this number will grow by 50%, reaching approximately $7.4 trillion by 2025. (The Social Shepherd)
  • On average, a consumer makes 19 online transactions per year. (The Social Shepherd)
  • It’s estimated there are anywhere between 12 and 24 million online stores. (The Social Shepherd)
  • In 2020, Amazon saw almost 3.68 billion monthly visitors on its website. (The Social Shepherd)
  • The second most popular online retailer was eBay, which saw a monthly average of 1.01 billion visitors. (The Social Shepherd)
  • 53% of people say free shipping is one of the main reasons they choose to shop online. (The Social Shepherd)
  • The next three reasons are coupons/discounts (41%); reviews from other customers (35%); and easy returns policy (33%). (The Social Shepherd)
  • China tops the list of e-commerce markets, generating more than $2,700 billion in e-commerce sales during 2021. In second place is the U.S. with $843.15 billion, and then the UK with $169.02 billion. (The Social Shepherd)
  • In 2020, Argentina had the fastest e-commerce growth with a 100.6% increase in online sales. (The Social Shepherd)
  • 38.4% of online shoppers based in the U.S. are under the age of 35. (The Social Shepherd)
  • Only 14.4% of those shopping online in the U.S. are 65 and above. (The Social Shepherd)
  • The overall budget of agencies working in e-commerce projects is estimated to be €$40,992.35. (Sortlist Data)
  • A total number of 17,064 e-commerce works have been completed by Sortlist agencies. (Sortlist Data)
  • France and Spain are the two leading markets for e-commerce (1,289 and 627 works, respectively). (Sortlist Data)

E-commerce Statistics: UK

60m

Number of digital buyers in the UK in 2022

30%

Percent of retail sales that came from online purchases

Desktop

Where users tend to spend more despite mobile access

statistics for top industries for ecommerce in the uk

  • From 2021 to 2025, it’s predicted the overall e-commerce revenue in the UK will grow at an annual rate of 5.16%. (The Social Shepherd)
  • In 2022, the country was expected to have nearly 60 million e-commerce users—leaving only a minority of the population as non-digital buyers. (Statista)
  • 72% of retail site visits in the UK came from a smartphone. (The Social Shepherd)
  • 67% of online shopping orders were made via mobile devices. (The Social Shepherd)
  • Only 25% of retail website traffic was from desktop computers and accounted for 29% of all purchases. (The Social Shepherd)
  • In retail alone, online sales constituted nearly 30 percent of overall retail sales in the country in 2021, over double the amount from exactly one decade prior. (Statista)
  • In 2020, internet retail sales grew by 47 percent, the fastest rate recorded in the previous ten years. (Statista)
  • Over one-fourth of retail sales from textile, clothing, and footwear stores come from online channels. (Statista)
  • Consumer electronics was the next highest grossing category in terms of revenue, with Amazon at the forefront of the leading online consumer electronics stores in the UK. (Statista)
  • Despite a mobile-commerce inclination, consumers still tend to spend more per order when they shop on their computers. (Statista)
  • In 2021, the average order value among online purchases was still the highest on desktop devices, with UK shoppers spending an average of 125 U.S. dollars on desktops in comparison to 102 dollars on tablets and 96 dollars on mobile phones. (Statista)
  • When it comes to sustainable retail, UK online shoppers seem to focus more on the products themselves having less or recycled packaging, rather than the delivery methods. (Statista)

E-commerce Statistics: France

80%

Users that bought online in 2021

#1

Biggest e-commerce market in the Sortlist marketplace

120k

Number of active e-commerce sites in France

active ecommerce sites in France

  • France is the leading country for e-commerce works, with close to 1,300 completed works at Sortlist. (Sortlist Data)
  • When ordering goods online, online consumers in France like to pay with their bank card, by far the most popular payment in France, with 80% preferring it over other methods. (Ecommerce News EU)
  • The next most popular payment methods are online banking (11%), consumer credits (4%), and bank transfers (1%). (Ecommerce News EU)
  • 77% of shoppers in France bought online in 2019, just 2 percentage points below 2020. It is expected to grow up to 80% in 2021. (Ecommerce News EU)
  • Fashion is the product category in France with the highest share of people buying online. (Ecommerce News EU)
  • Cultural goods (50%) and travel/tourism (40%) were other categories with a high popularity online. (Ecommerce News EU)
  • Categories such as home services (7%) and glasses and contact lenses (also 7%) are significantly less popular online. (Ecommerce News EU)
  • France is ranked as the sixth biggest e-commerce market worldwide. In Europe only Germany and the United Kingdom are bigger. (Ecommerce News EU)
  • France had an online retail market that reached over 112 billion euros by the end of 2020. (Ecommerce News EU)
  • Online sales in France accounted for 6% of total retail sales. (Ecommerce News EU)
  • There are more than 120,000 active e-commerce sites in France. (Ecommerce News EU)
  • Aside from Amazon, other big online players are Cdiscount, eBay, Fnac and Priceminister. (Ecommerce News EU)
  • In 2015, the average consumer spent 1,516 euros online, while it was already 2,266 euros in 2019. (Ecommerce News EU)

E-commerce Statistics: Spain

23%

Expected increase of the Spanish e-commerce market

2nd

Biggest e-commerce market in the Sortlist marketplace

Fashion

Accounts for 26.9% of Spanish e-commerce profit


  • After France, Spain leads the number of e-commerce works completed at Sortlist, with 627. (Sortlist Data)
  • Spain is the 16th largest market for e-commerce with a predicted revenue of US$37,615.7 million by 2023, placing it ahead of Netherlands. (Ecommerce DB)
  • Revenue is expected to show an annual growth rate of 10.6%, resulting in a projected market volume of US$56,357.9 million by 2027. (Ecommerce DB)
  • With an expected increase of 24% in 2023, the Spanish e-commerce market could contribute to the worldwide growth rate of 17% in 2023. (Ecommerce DB)
  • Fashion is the largest market and accounts for 26.9% of the Spanish e-commerce revenue. (Ecommerce DB)
  • It is followed by Food & Personal Care with 26.4%, Electronics & Media with 24.6%, Furniture & Appliances with 12.4%, and Toys, Hobby & DIY with the remaining 9.7%. (Ecommerce DB)
  • In Spain, Amazon had a revenue of US$5,347.0 million in 2021. (Ecommerce DB)
  • Amazon ES was followed by El Corte Inglés and PCComponentes as the second- and third-largest stores with US$2,135.8 million and US$720.5 million, respectively. (Ecommerce DB)
  • Altogether, the top three stores account for 41.5% of the top 100 online stores' revenue in Spain. (Ecommerce DB)
  • The market volume of the top 250 Spanish online stores has increased by 76% since 2018. Net sales in 2020 were USD 19 billion. For 2021, the forecast was estimated at USD 23 billion. (International Trade Administration)
  • User penetration will be 71.2% in 2023 and is expected to hit 84.8% by 2027. (Statista)
  • The top 5 shipping providers in Spain are: Click & Collect, Correos, SEUR, UPS and GLS. (International Trade Administration)
  • More than 30% of internet users are buying or selling through C2C channels such as Wallapop, Vinted, Milanuncios, and Vibbo. (International Trade Administration)

E-commerce Statistics: The Netherlands

$30.6 billion

What the Dutch e-commerce industry was valued at in 2021

25-44 y/o

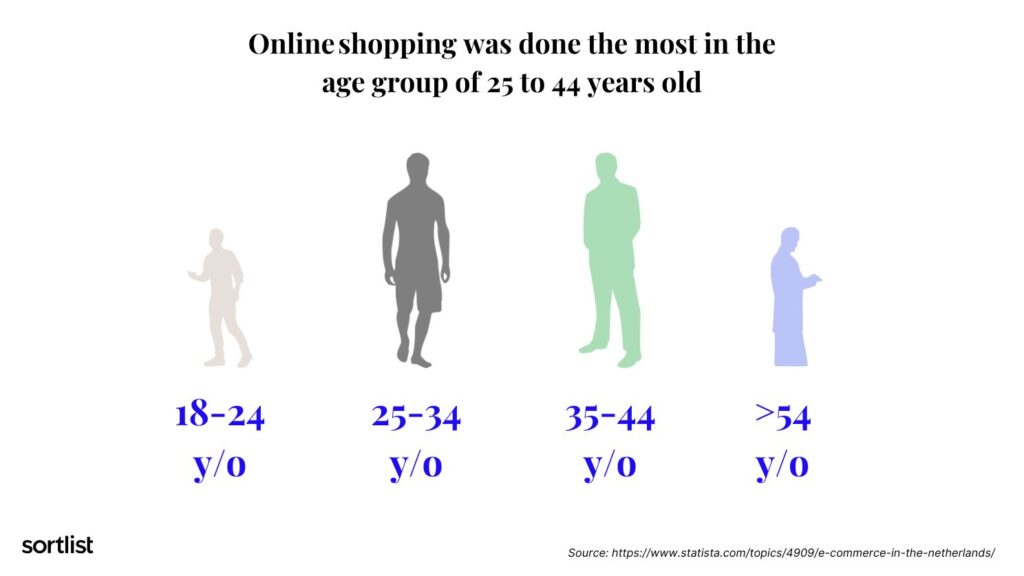
Online shopping was mostly done by this age group

Bol

Biggest local player in the Dutch e-commerce market

statistics for online shopping by age group in the netherlands

  • The Netherlands is the 17th largest market for e-commerce with a predicted revenue of US$30,585.8 million by 2023. (Ecommerce DB)
  • Over 3% of the Netherlands’ GDP was derived from online shopping. (Statista)
  • In 2021, the Dutch e-commerce industry was valued at 30.6 billion euros, surpassing 373 million online orders. (Statista)
  • In the last decade, the Dutch e-commerce market has grown by over 20 billion euros. (Statista)
  • Online shopping was done the most in the age group of 25 to 44 years old. (Statista)
  • Over 90% of consumers stated that they bought goods on the internet. (Statista)
  • Apps such as Swish, Mobilepay, and Vipps are used for e-commerce payments by almost 60% of consumers in the Netherlands. (Statista)
  • Men commonly shop online more than women, with an almost five-percentage-point difference. (Statista)
  • For both genders, the most popular products to purchase online include clothing, shoes, and accessories. (Statista)
  • Fast-growing product segments include tickets, attractions, events, and travel packages — all comeback sectors in the post-COVID-19 recovery. (Statista)
  • The biggest online stores in the Netherlands include local players like online hypermarket Bol.com, electronics retailer Coolblue, and the supermarket Albert Heijn. (Statista)
  • With a significantly lower share of visits than other Dutch e-commerce sites, Amazon is still among the most popular platforms, but a staggering 96% of Dutch consumers purchase on national sites compared to only 40% on foreign websites. (Statista)

E-commerce Statistics: Germany

50%

Percentage of order returns in Germany

Invoices

The preferred payment method in Germany

59%

Number of online purchases made via smartphone

statistics for order return rate in Germany

  • As of 2021 it is estimated 83.2 million people live in Germany, of which 91.4% use the internet. (Ecommerce News EU)
  • Traditionally, online shoppers in Germany are keen on using invoice, for years a preferred online payment method. (Ecommerce News EU)
  • Online fashion is the most popular product category in Germany, followed by consumer media and electronics. (Ecommerce News EU)
  • Especially in the categories ‘consumer electronics & computers’ and ‘media,’ German consumers are keener on shopping online instead of shopping offline. (Ecommerce News EU)
  • 85% of German citizens shopped online during 2020, and 95% of the population had been online that year. (Ecommerce News EU)
  • Germany is known for its high return percentage. Some reports claim that 50% of all orders are sent back. (Ecommerce News EU)
  • The German market was worth 53.3 billion euros in 2018 and was expected to reach 57.8 billion euros in 2019. (Ecommerce News EU)
  • In terms of purchasing activity nowadays there is virtually no disparity between the western and eastern parts of Germany any more. (Ecommerce News EU)
  • E-commerce in Germany seems all about two big players: American retailer Amazon and German-founded Otto. They own almost half of the online market, so it’s hard for smaller merchants to make a difference. (Ecommerce News EU)
  • The current top 5 online stores in Germany are: Amazon (€15.68 billion), Otto (€5.12 billion), MediaMarkt (€2.54 billion), Zalando (€2.52 billion), and Ikea (€1.75 billion). (Ecommerce News EU)
  • The strong e-commerce market in Germany can be attributed to the considerable proportion of the population who owns smartphones (81%). (International Trade Administration)
  • In 2021, 59% of online purchases were made via smartphone. (International Trade Administration)

E-commerce Statistics: MENA

Lack of trust

Involved in 42% of e-commerce issues in MENA

52%

MENA residents that shopped more in 2022

Home care

Fastest growing e-commerce sector b/w 2019 and 2020

statistics for growth of ecommerce in the mena region

  • In the past three years, e-commerce has grown faster in the Middle East and North Africa (MENA) region than anywhere else in the world, with an estimated 209 million consumers transitioning to online shopping during the height of the pandemic. (Zawya)
  • 91% of users in the region are regularly shopping online. (Zawya)
  • More than half (52%) of MENA residents shopped more frequently in 2022, up from 47% in 2021. (Zawya)
  • The value of e-commerce in the Middle East in 2020 amounted to around 17 billion U.S. dollars. (Statista)
  • Of that amount, 5.5 billion U.S. dollars was in Saudi Arabia, and 4.5 billion in the United Arab Emirates (UAE). (Statista)
  • The value of e-commerce in the Middle East was expected to exceed 27 billion U.S. dollars by 2025. (Statista)
  • E-commerce penetration within the MENA region in 2017 was fastest in Turkey and the UAE, as it amounted to 4.2% of total retail in those countries. (Statista)
  • 37% of the e-commerce transactions in MENA were paid for by Visa card as of January 2020. (Statista)
  • In the same period, card payments were the most popular payment method in the region at 44%. (Statista)
  • Between 2014 and 2016, 42% of the conversations about e-commerce issues across MENA countries were related to the lack of trust in e-commerce. (Statista)
  • Between 2019 and 2020, the fastest growing e-commerce sector in the MENA region was home care, with a compound annual growth rate of 381%. (Statista)
  • The consumer health and food and drink sectors also showed high e-commerce growth in that period. (Statista)

Conclusion

The e-commerce industry is growing at an unprecedented rate, with consumers around the world turning to online shopping platforms for their shopping needs. Our compilation of e-commerce statistics by country has provided a comprehensive overview of the state of the industry in different regions, highlighting the key trends and developments shaping the market.

From the growing use of mobile devices to the rise of social media as a shopping tool, the statistics show that e-commerce is transforming the way we shop and do business. As businesses of all sizes continue to adapt to the changing landscape, it is clear that e-commerce will continue to play an increasingly important role in the global economy.

About the Sortlist Data Hub

The Sortlist Data Hub is the place to be for journalists and industry leaders who seek data-driven reports from the marketing world, gathered from our surveys, partner collaborations, and internal data of more than 50,000 industries.

It is designed to be a space where the numbers on marketing are turned into easy-to-read reports and studies.

close

Access our exclusive content!

email