

2021 Sortlist Report: The Most In-Demand Digital Industries and the Top Locations for Creatives
Published on: 29 Sep 2022 | Author: Aline Strouvens

Published on: 29 Sep 2022 | Author: Aline Strouvens
Creative work is in higher demand now than ever before, with the growth in online connectivity and the digital industries.
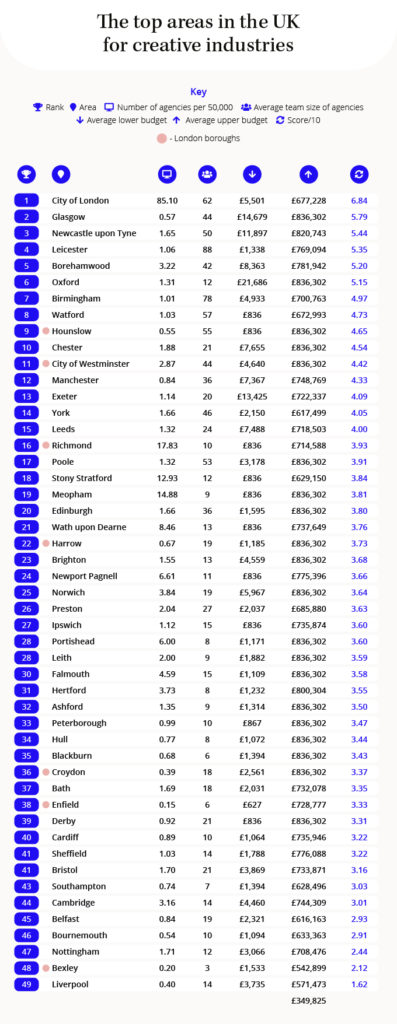
Sortlist reveals the best cities and towns in the UK for digital creatives, the best countries for creative industries, and the most in-demand digital agencies of 2021.
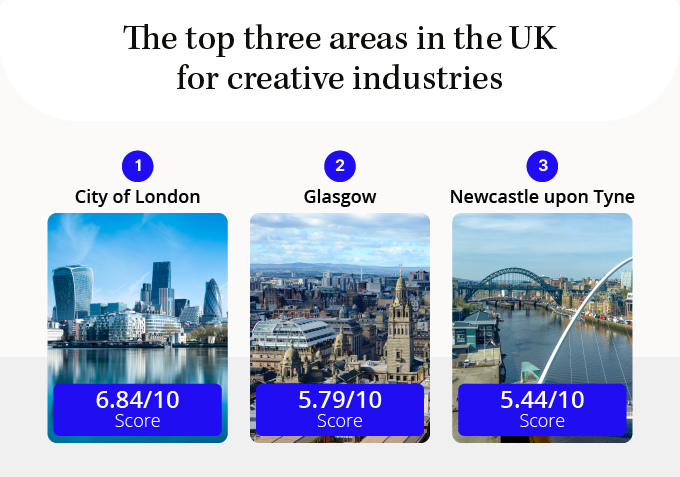
With a growing scene of startups and digital agencies, the City of London tops the list as the best place for creatives.
There are 85 active digital agencies registered on Sortlist for every 50,000 residents.
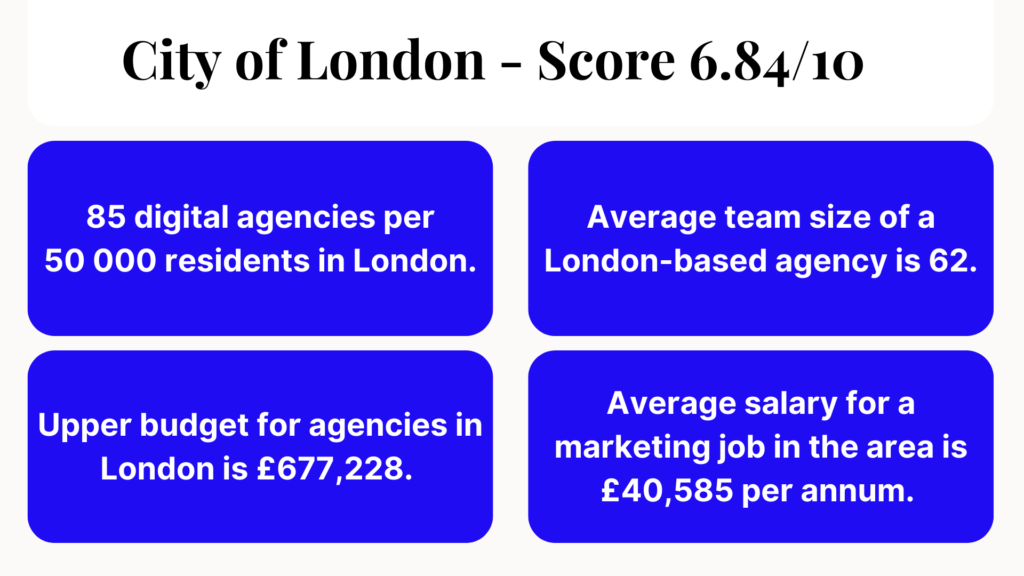
The average upper budget listed by the City of London’s digital agencies is £677,228 – one of the highest in the UK.
The average team size of agencies in the City of London is 62 and the average salary for a marketing job in the area is £40,585 per annum.
The third-largest city in the UK is now named one of the best places for creatives.
Although, there is fewer than one agency for every 50,000 people in the city, the average minimum budget listed by Glasgow agencies on Sortlist is over £14,679. The average upper budget is also one of the UK’s highest, at over £820,743.
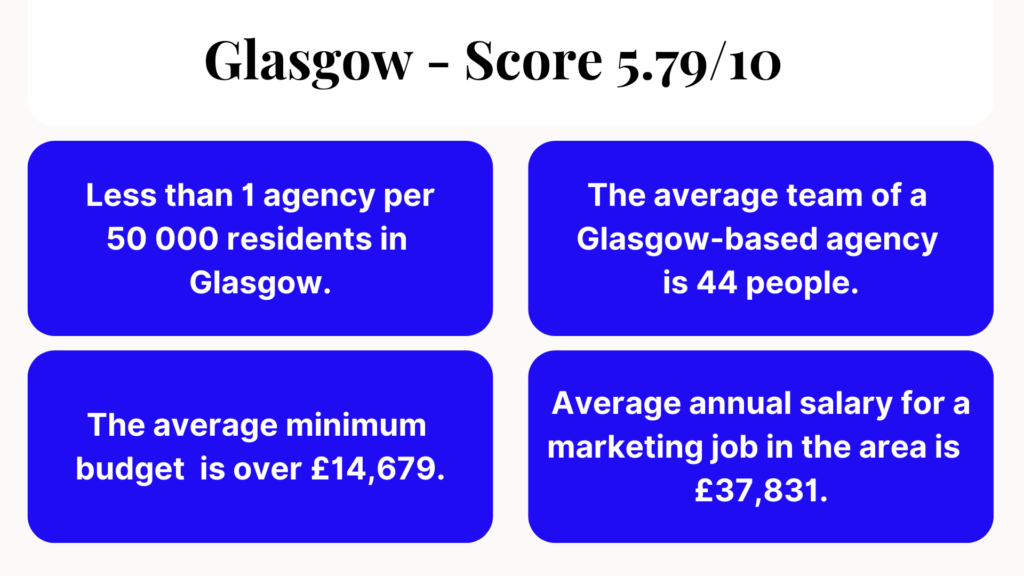
The city also has an average team size of 44 people and an annual marketing salary of £37,831.
The North East city of Newcastle upon Tyne rounds out the top three UK cities for creatives.
For every 50,000 people, Newcastle has 1.65 agencies, the average minimum budget in the city is £11,897, the average upper budget is a huge £769,094.
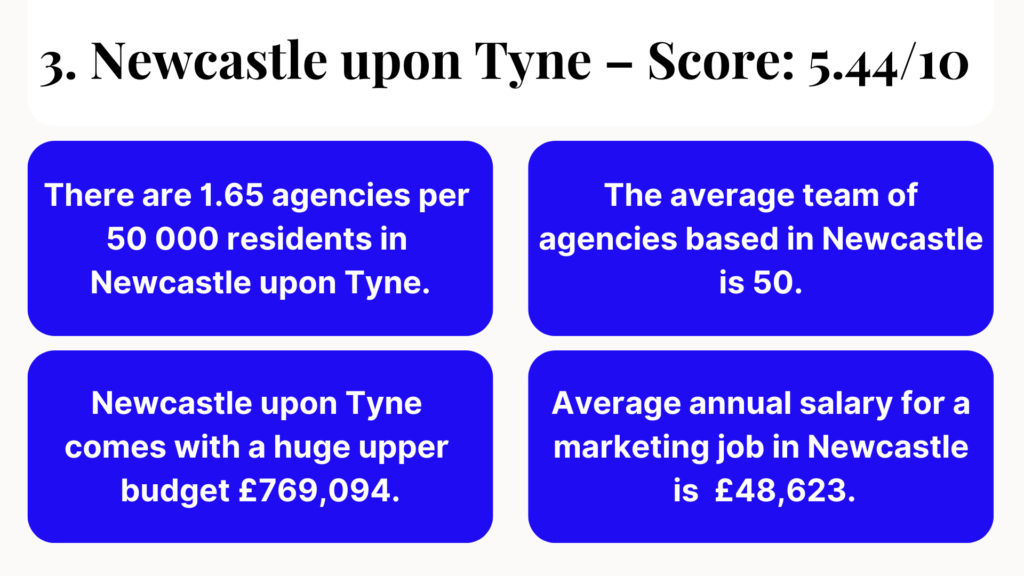
When it comes to team size, Newcastle upon Tyne is home to large teams, with an average of 50 people in a team.
Newcastle ranks well for marketing salaries, with the yearly average being £48,623.
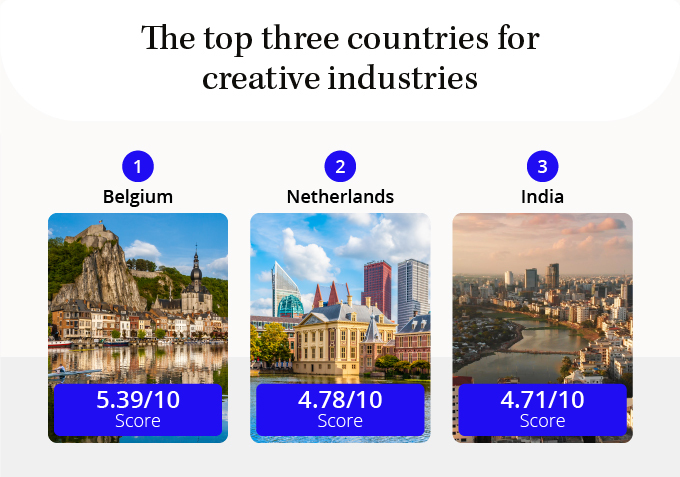
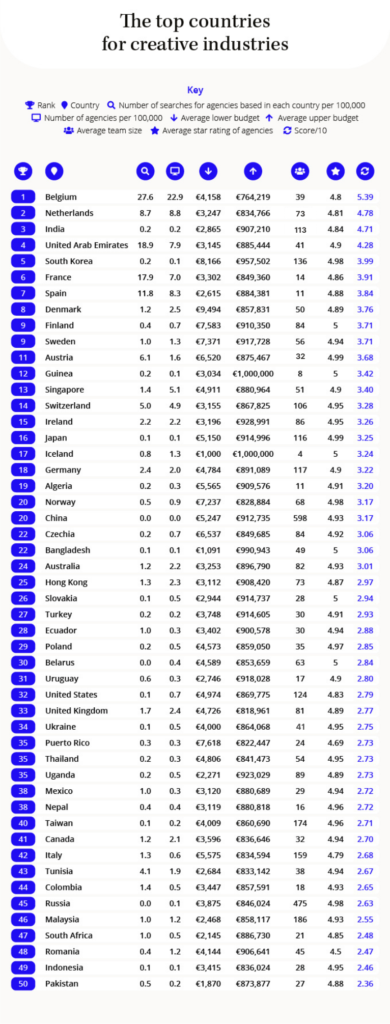
It’s no surprise to see Belgium in the top spot, as the best country for digital industries.
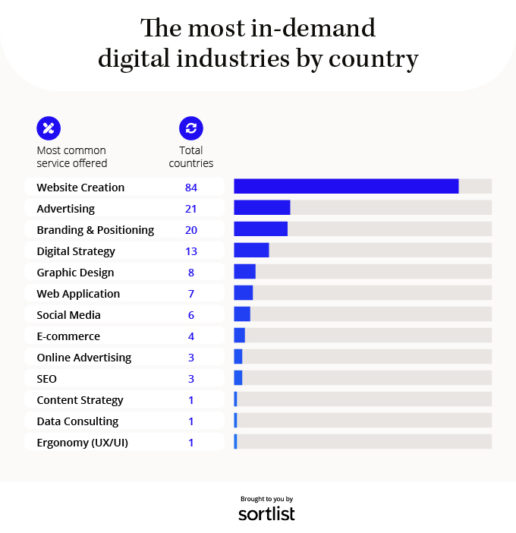
For every 100,000 people, there are over 22 digital agencies in Belgium that are registered on Sortlist. The most common service listed is website creation.
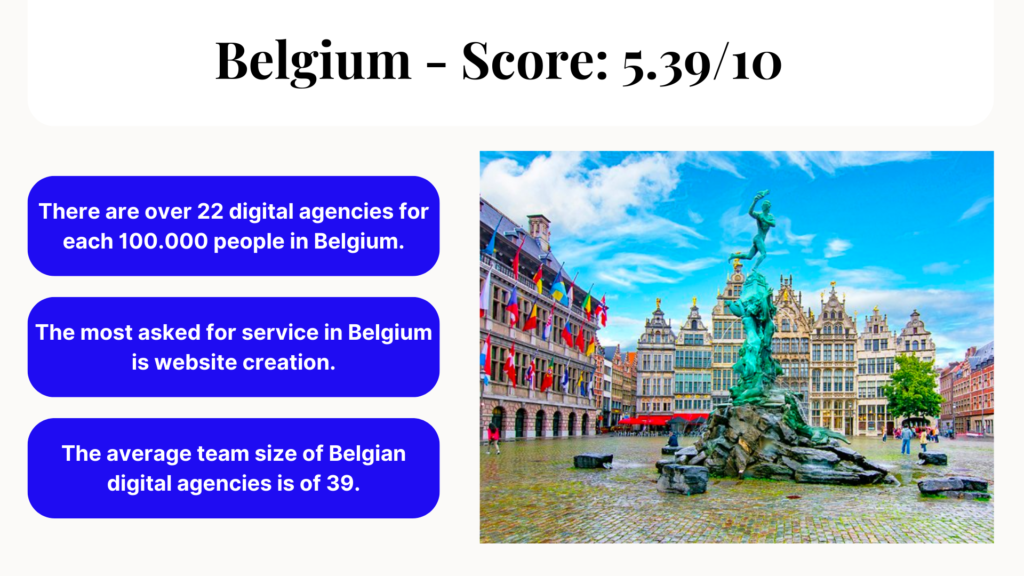
However, the average team size for creative agencies on Sortlist in Belgium is 39, meaning there could be fierce job competition.
Built on the legacy of some of the most famous artists of all time, including Rembrandt, Vermeer, and van Gogh, the Netherlands has one of the richest creative scenes in the world.
In 2021, the demand for creative services is met, with over 8 live agencies, per 100,000, based in the Netherlands.
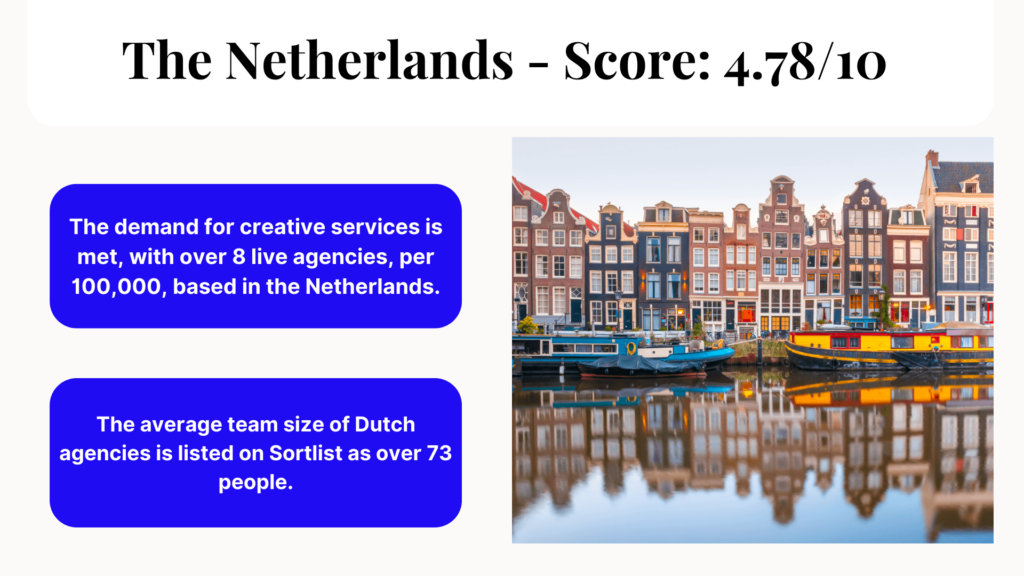
The average team size of Dutch agencies is listed on Sortlist as over 73 people, indicating large projects and the possibility of positive career prospects for job-hunting creatives.
India is one of the best countries for creative industries – most known for their involvement in the media and entertainment industries.
There are over 0.2 Indian creative agencies on Sortlist for every 100,000 residents, but over 700 in total. The most common service advertised is website creation.
The average upper budget of agencies in India on Sortlist is over €900,000 and the average team size is over 100!
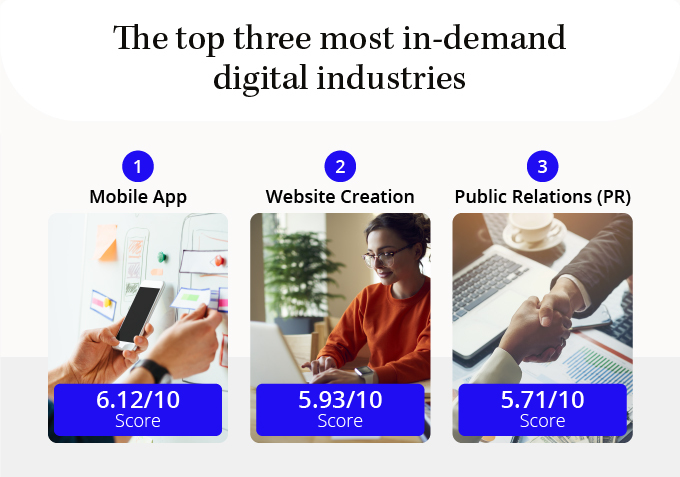
Mobile apps are the perfect way to keep your target audience entertained, as mobile phones are an integral part of daily life for most.
There are over 4,500 agencies in the world on Sortlist that offer mobile app development as a service.
Although there are fewer agencies than for branding and social media, the average team size in the mobile app industry is 46 people – one of the largest out of all sectors!
The average budget for agencies in mobile app development shows there’s money in the industry – at over €74,000, the only agencies with a higher average budget are in gaming!
Website creation encompasses everything from graphic design and user interface to coding. With such a wide variety of roles and the rising need for businesses to have a high-quality website, it’s easy to see why web creation is in high demand.
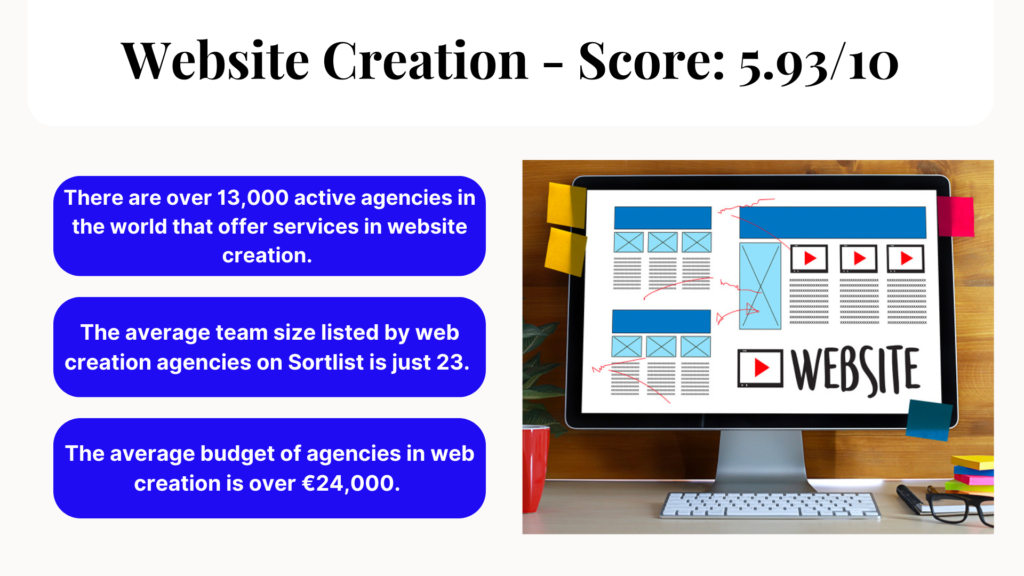
On Sortlist, there are over 13,000 active agencies in the world that offer services in website creation. It was the most common service offered by almost half of all countries!
The average team size listed by web creation agencies on Sortlist is just 23. The average budget of agencies in web creation is over €24,000.
Public relations is one of the most effective ways to build your business and grow your brand, so it’s no wonder that it’s one of 2021’s most in-demand industries.
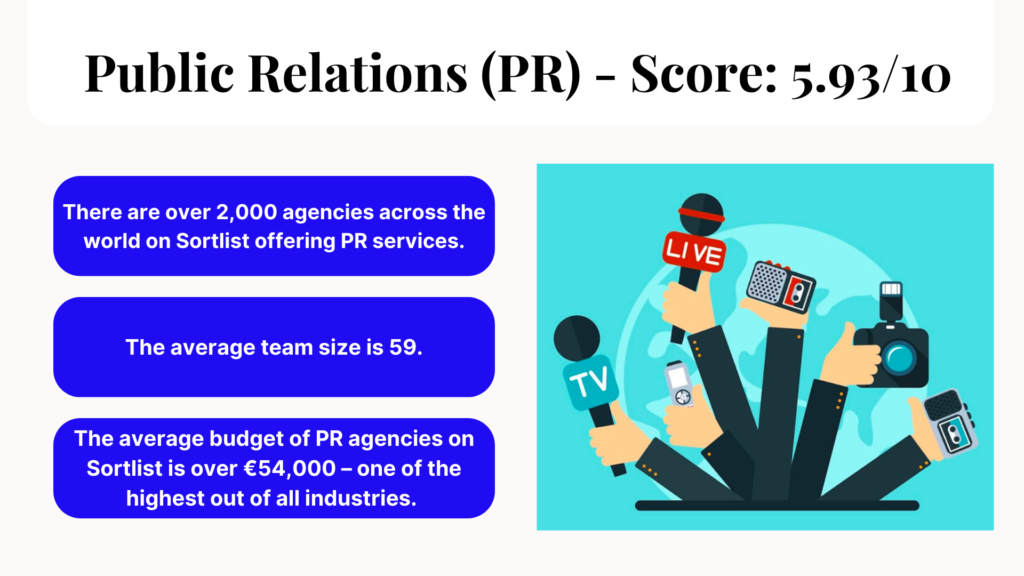
There are over 2,000 agencies across the world on Sortlist offering PR services, and the average team size is 59.
The average budget of PR agencies on Sortlist is over €54,000 – one of the highest out of all industries.
We looked at average salaries in marketing according to Glassdoor submissions, comparing these monthly salaries to the average monthly cost of living (minus rent or mortgage costs) to find which cities had the highest proportion of salary remaining after cost of living is factored in.
With an average annual salary of £60,115, marketing experts in the Lancashire town of Blackburn get the most bang for their buck. The average cost of living for a single person, without factoring in rent or mortgage costs is just £559.79 per month, leaving marketers in the area with 88.83% of their monthly income.
In second place is another Lancashire location, the city of Preston. The average annual salary in this city is £65,358 while the monthly cost of living is just £615.28. This leaves Preston marketing specialists with 88.70% of their salaries before they pay their monthly housing costs.
Proving that the north west reigns supreme, the city of Liverpool rounds out the top three cities with an average annual salary of £55,666. Cost of living stands at an average of £662.12, leaving 85.73% of the monthly salary.
When we look at salaries at a country level, we can see which locations offer the most when compared to the cost of living. Salaries are taken as averages, so may vary largely across the country.
Sitting at the top of the list is the United States with an average monthly salary of €5,495 and an average cost of living of €827. This leaves 84.95% of salary before housing costs are accounted for.
In joint second place, Finland has an average marketing salary of €3,676 per month with a cost of living average of €673, leaving 81.69% of salary after cost of living is accounted for.
Denmark rounds out second place with an average monthly salary of €5,078 and an average of €930 for cost of living.
To find the best locations for creatives we used data obtained from Sortlist on the following factors: number of live agencies in the area, number of searches for agencies based in the area, average budget of agencies, average team size, and average star rating. Areas with incomplete data were removed before they were ranked, and the top 50 were revealed.
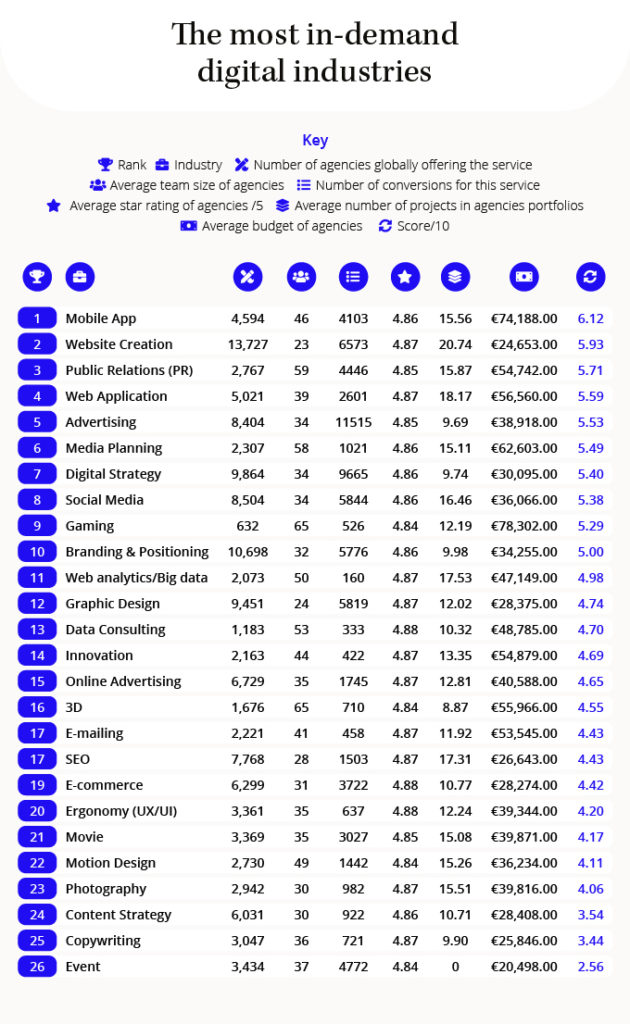
To find the most in-demand industries, Sortlist data was collected for the following factors: number of agencies in the world offering the service, average team size, number of projects advertised, average star rating of agencies offering the service, average number of projects in agencies portfolios, and average budget. This formed the final ranking.
The score was achieved by giving each factor a normalised score out of 10. An average of each of these scores was then taken to give an overall score out 10 for each city, country and industry.
Salary data is taken from averages submitted to Glassdoor. This was then compared against the average monthly cost of living for a single person in each area without rent or mortgage costs included, taken from Numbeo.
The populations for each location were taken from the most recent figures listed on Wikipedia.

The Sortlist Data Hub is the place to be for journalists and industry leaders who seek data-driven reports from the marketing world, gathered from our surveys, partner collaborations, and internal data of more than 50,000 industries.
It is designed to be a space where the numbers on marketing are turned into easy-to-read reports and studies.